At the Hofermühle site, monitoring efforts extend beyond subsurface investigations to include key information about surface dynamics. Particularly, a weather station continuously collects key weather parameters, while terrestrial laser scanning (TLS) and UAV surveys are conducted at regular intervals to monitor surface changes in the area of interest. In addition, multi-temporal GNSS measurements and detailed geomorphological mapping further complete the monitoring framework, providing a comprehensive understanding of slope processes and landscape evolution. Below, further details on each monitoring technique are provided.
Meteorological Station
Since July 2015, a weather station (Figure 11) has been in operation on site, continuously recording parameters such as temperature [° C], humidity [%], radiation [W / m²], wind speed [m / s] and precipitation [mm]. A snow depth sensor [m] has been installed January 2019, and a barometer [mBar] in June 2019. The data is recorded with a measurement interval of 5 minutes, transferred to the server in Vienna where it can be accessed in real time via the Monitoring page.
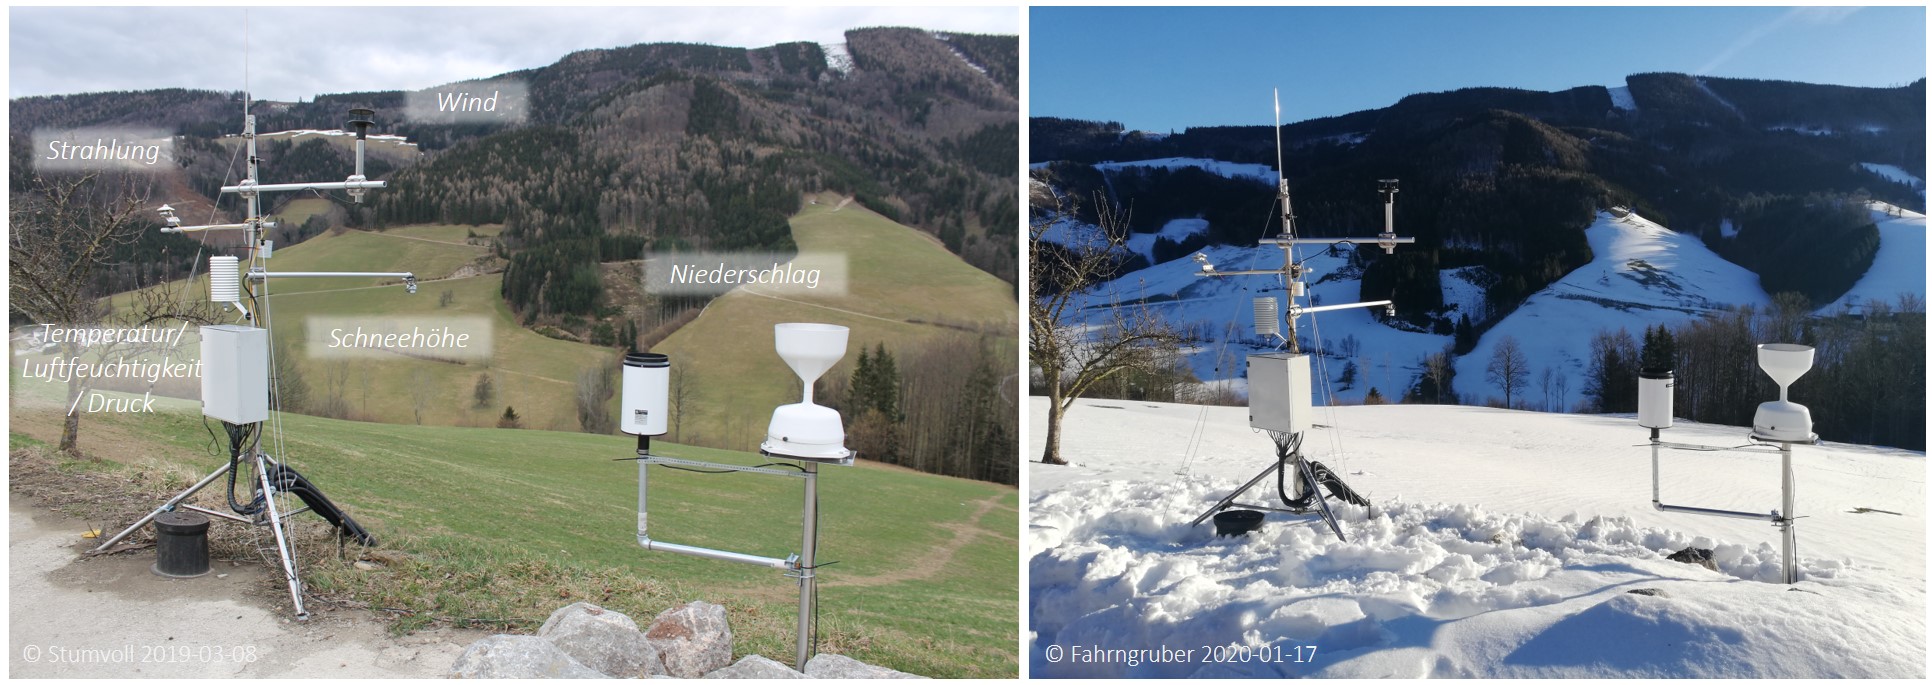
Figure 11: Weather station and measuring devices at the Hofermühle site. © Photographs see individual notes.
Cosmic Ray Neutron Sensing (CRNS):
The formation of landslides is influenced by numerous factors, with soil moisture playing a central role in slope stability. Therefore, the use of reliable measurement technologies for continuous monitoring of soil moisture is crucial to gaining a better understanding of these processes. An innovative method for this is cosmic ray neutron sensing (CRNS). This technology measures the number of neutrons near the ground that are generated by cosmic radiation—since water in the soil strongly absorbs neutrons, the moisture content can be derived from this in a large area and non-invasively.
Terrestrial Laser Scanning (TLS)
The focus of the surface investigation lies on terrestrial laser scanning (TLS). Since November 2015 the Hofermühle has been recorded from the opposite side of the slope using two scanning positions (Figure 12). The campaign intervals are around 3 to 6 months. The focus of the recording is in the autumn and spring months; low vegetation cover and leaveless trees allow the best possible coverage and resolution during this time.
The multi-temporal data is used to create surface difference models (DEMs of Difference (DoDs)). They provide information about the location and magnitude of mass displacements.
Results: Under construction
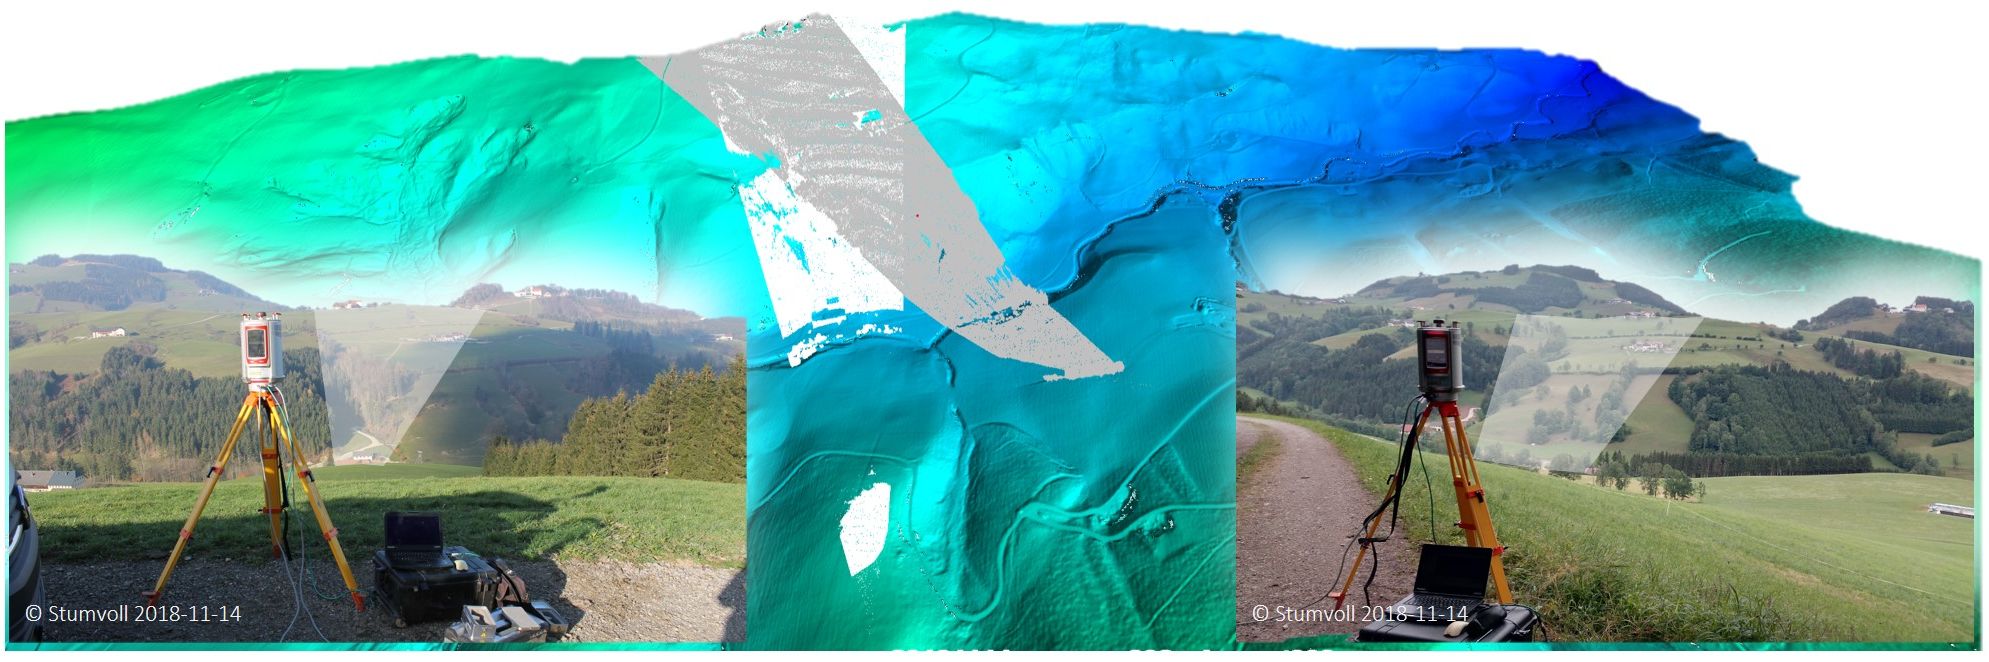
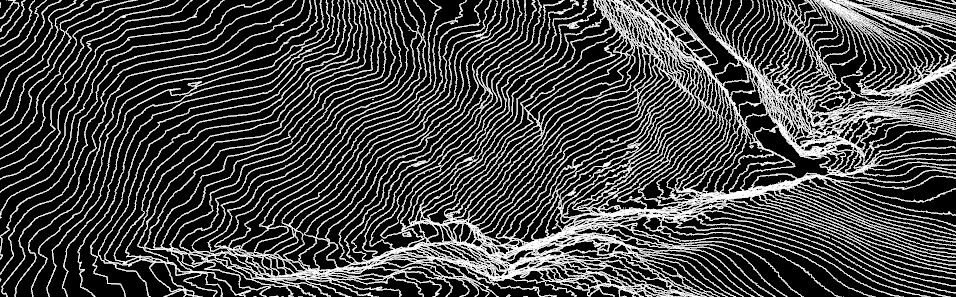
Figure 12: Scan positions and coverage of the multi-temporal TLS campaigns at the Hofermühle site. (DEM (1m) 2009: made available by the Federal State Government of Lower Austria). © Photographs see individual notes. Graphics: Stumvoll M.J. 2019, also in Stumvoll & Glade 2019.
UAV (Unmanned Aerial Vehicle) surveying and SfM (Structure from motion)
Due to shadowed areas in the TLS measurements and for scientific motivation, UAV flights are also carried out parallel to the TLS recordings. The corresponding image material is processed into terrain models and orthophotos via SfM.
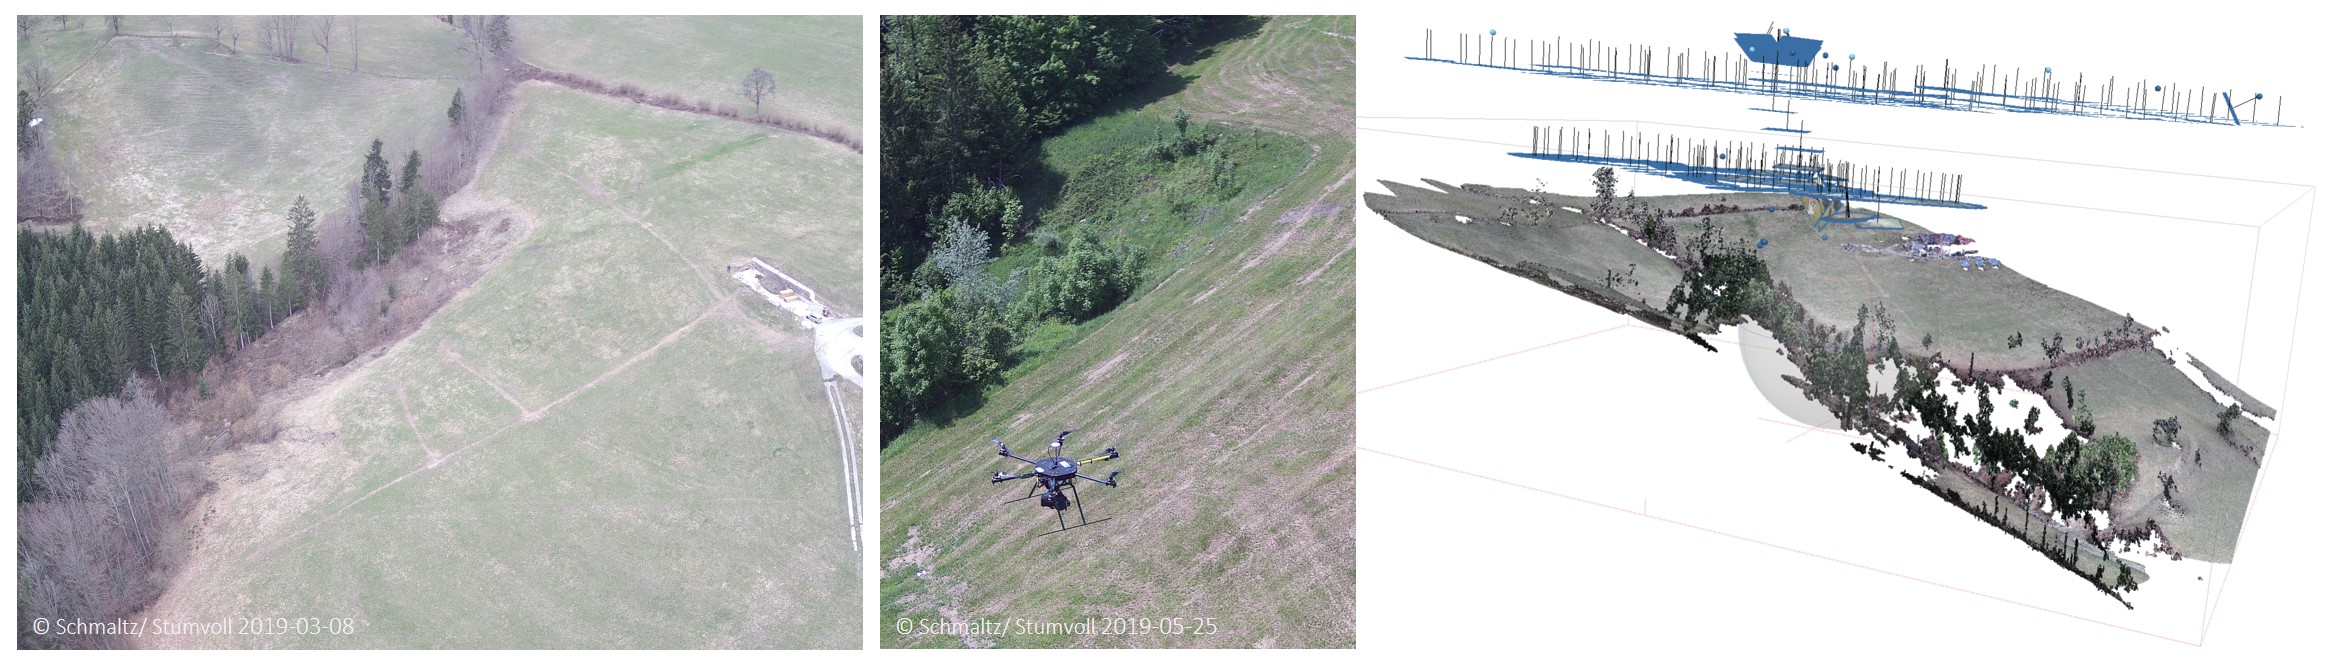
Figure 13 (left and middle) Impressions of the UAV flights at the Hofermühle site, spring 2019. (right) Point cloud display of an aerial image data analysis for March 8, 2019 in Agisoft Photoscan software. (Pilot: Schmaltz E.M.), © For photographs see individual notes. Graphics: Stumvoll M.J. 2020.
GNSS measurements (completed)
With the aim of recording purely surficial movement patterns by means of point measurements, around 60 reference points in the form of marked boulder stones were created at the Hofermühle and buried on the surface. These have been measured about once a month since 2014 using manual GPS measurements. The measurements were discontinued in 2019.
(Geo)morphological mapping
The entire catchment area of the Hofermühl torrent and in particular the active process areas were mapped in detail with respect to (geo) morphological aspects via the evaluation of digital terrain models and numerous intensive site inspections.
Results: under construction
Greenhouse gases monitoring
At the Hofermühle site, it is also applied a non-flow-through, non-steady-state chamber technique to sample soil greenhouse gases, specifically CO₂, CH₄, and N₂O. This monitoring approach is currently developed in collaboration with the Geoecology research group of the University of Vienna. The chambers are placed in pre-selected plots based on the relationship between the gas emission and the slope processes affecting the area of interest in Hofermühle (Figure 14 under construction). Gas samples are collected monthly and analyzed using the gas chromatography to quantify their concentrations. Based on these concentrations, GHG fluxes are then calculated. In addition, soil samples are collected in order to analyze key soil parameters, including bulk density, particle size distribution, moisture content, soil organic content, and pH, to assess the influence of these parameters on GHG soil emissions. The integration of these methods provides a comprehensive understanding of the spatial and temporal variability of soil gas fluxes in the studied site.
")
")